
Definition:
Descriptive analytics is a preliminary stage of data processing that creates a summary of historical data to provide useful insights and prepare the data for further analysis.
To answer the question “What happened in the business?” descriptive analytics is used. Thanks to this, data and information are analyzed to describe the current situation of business in a way that trends, patterns and exceptions become evident. This then takes the form of reports, dashboards, etc.
Applications of descriptive analytics
Descriptive analytics helps organizations understand what happened in the past (the past in this context can be from a minute ago or a few years ago). With descriptive analytics, the relationship between customers and products is understood, and its objective is to obtain an understanding of the approach that will be adopted in the future: to learn from past behavior in order to influence future results.
Why use descriptive analytics?
Descriptive analytics does exactly what its name implies: “Describe.” They are analyses that describe the past. The vast majority of the statistics we use fall into this category (for example, in basic arithmetic: sums, averages, changes per cent). Typically, the underlying data is a count of data to which basic mathematics is applied. For all practical purposes, there are an infinite number of these statistics.
Descriptive analytics is useful for showing things like total volume in inventory, average euros spent per customer, or year-to-year change in sales of a product. Common examples of descriptive analytics are reports that provide historical insights into a company’s production, finance, operations, sales, finance, inventory, and customers.
A cinema app, for example, would use descriptive analytics to find correlations between the different movies that its subscribers have liked and thus improve its recommendation engine, using sales data and customer history.
Therefore, descriptive analysis is an important source for determining what to do next in a campaign or event.
Descriptive analytics in the online environment
In the online environment we find web analytics, where descriptive analytics conveys the current situation of the web at the level of metrics: how many users have come, how many visits they have made, what pages they have seen, from what sources, how long their session has lasted …
Stages of analytics
Descriptive analytics is a preliminary stage of data processing that creates a summary of historical data to provide useful insights and thus prepare the data for further analysis. Data mining and its processing organizes the data and makes it possible to identify patterns and relationships in the same that are not otherwise visible. In this way, the consultation, information and visualization of data can be applied to obtain a clearer view.
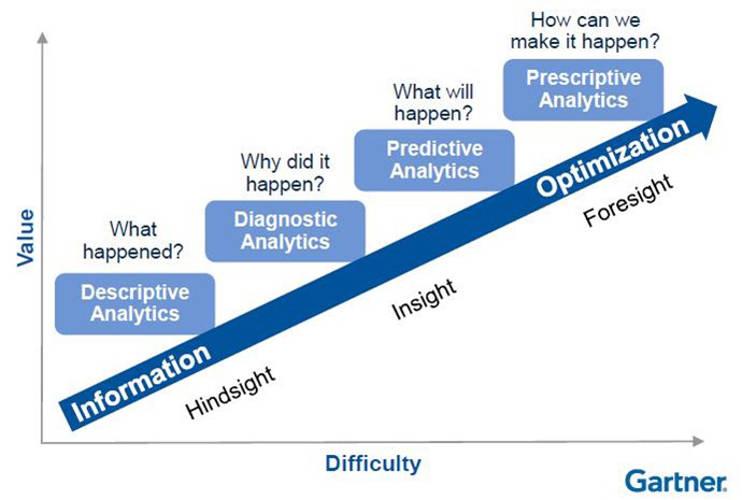
Descriptive analytics therefore provides insight into what happened. This would be to see, for example, an increase in Youtube followers after uploading a particular video. Then the next step of the process would intervene, the diagnostic analysis, a deeper study of the data to try to understand the causes of the events and behaviors. Next comes predictive analytics, which is used to identify probabilities and future trends, which provide insights into what might happen in the future. Finally, prescriptive analytics would be used, which is applied to try to identify the best outcome of events, taking into account the parameters, and suggest decision options to make the most of the opportunity of a future or mitigate a possible risk.