Definition:
A dashboard is a user interface, which can bear some resemblance to a car’s control panel, where information is organized and presented in a way that is easy to read. This control panel is more interactive than the one that a car can present us, unless it is more modern and based on a computer screen.
To some extent, most graphical user interfaces (GUIs) resemble a dashboard. However, some product developers consciously employ this metaphor so that the user instantly recognizes the similarity.
What are dashboards for?
A dashboard is a visual representation of the most important information needed to achieve one or more goals, consolidated and arranged on a single screen so that information can be controlled at a glance.
Main features of a dashboard
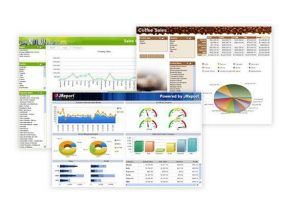
- All visualizations enter a single computer screen: scrolling to see more ends with the definition of a dashboard.
- It shows the most important performance indicators or performance measures to monitor.
- Interactivity, such as filtering and drill-down, should be easy to employ in a dashboard. However, these types of actions should not be mandatory to see what the indicators of underperforming are.
- It is not designed exclusively for executives, but rather should be used by the general workforce. As effective instruments they are, they should be easy to understand and use by all.
- The data displayed should be updated automatically without any help from the user. The frequency of the update varies depending on the organization and objectives. The most effective dashboards have up-to-date data at least on a daily basis.
Dashboards are a great way to do a website analysis. You can save a lot of time on a day-to-day basis so it is certainly worth investing time to have the right data.