
Definition:
Power BI is a free cloud-based business analytics and data visualization service. Built into the Microsoft Office 365 productivity suite, this Business Intelligence (BI)tool lets you monitor the health of a business through a live dashboard, create interactive reports with Power BI Desktop, and access data anywhere with native mobile apps.
Power BI features
Power BI includes both a downloadable desktop program and a cloud service, each of which offers different but overlapping capabilities, as well as a mobile app for iOS, Android, and Windows that let you view Power BI reports and dashboards.
It currently has more than 5 million users and is used by more than 200,000 companies. It is widely used in web analytics agencies and companies specialized in Business Intelligence.
How Power BI works
 Power BI is a free tool with monthly updates and a wealth of technical information available from your website. Its simple use also does not require prior learning to start sharing and managing queries. The possibility of sharing the relevant data with the entire team and consulting the BI panels in real time allows to solve with greater solvency any setback that arises to the company.
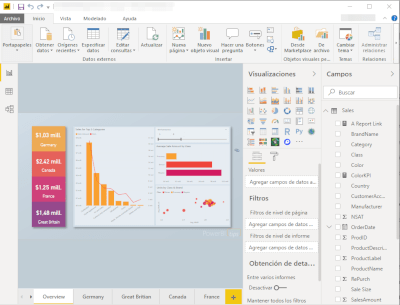
Power BI is a tool with a Microsoft Office-style interface, intuitive enough for users familiar with database and Microsoft Suite programs, and various menus.
It allows you to create and share dashboards and reports and share.
In the top menu we can select options such as
- Data collection
- Edit queries
- Create Visual
- Add buttons, images, shapes
- Manage relationships between tables
- Create measures
- Publish dashboard
In the menu on the side you can select:
- Views
- Values
- Filters
- Fields
Once the data is modeled, the visualizations can be easily generated, for which you only have to select the metrics and dimensions to be displayed, and drag the type of data that you want to show in the report.
Power BI components
Power BI consists of a Windows desktop app called Power BI Desktop, an online service called Power BI, and a set of apps for iOS and Android devices.
These three components allow the user to create visualizations from data obtained from different sources, share and visualize the data from different devices.
Workflow in Power BI
The Power BI workflow follows the following order:
- In Power BI Desktop, data is obtained through the different existing connectors
- Data is crossed and data visualizations and reports are generated
- Reports and visualizations are published through the Power BI service
- Different users can consult these reports through apps on their Android and iOS mobiles.
Where to get Power BI
Microsoft offers free downloads of the following for Power BI:
- Microsoft Power BI Desktop
- Microsoft Power BI Mobile
- Microsoft On-Premises Data Gateway
- Microsoft Power BI For Excel Publisher
- Publish reports to local storage with power BI report server
- Microsoft Power BI Report Builder
All of these Power BI components can be obtained directly from the Microsoft web: