One of the practices that tends to favor search engine positioning is the generation of links on a website. In general, link building,both external and internal, gives authority to a domain and favors a hierarchical structure of the page.
Explained in a summarized way, external backlinks are the links that link to your website or any of its links or content. While internal backlinks is the generation of internal links that point to our own pages, so that it facilitates navigation.
It is thus understood that the role of a good internal linkbuilding is in the hands of SEO experts. Throughout this article, we will show, first, how to detect all the internal links of our website with the Screaming Frogtool. And second, how to visualize them with Gephi in a way that gives a global vision, with which you can easily identify the structure and hierarchy of all the internal links of a website.
Table of Contents
1. Before using Gephi: detect and analyze internal links with Screaming Frog
There are numerous tools with which it is possible to see the link structure of a web page. In this case, we will use Screaming Frog, a program that can be downloaded for free, both for Windows, Linux or Mac, and that allows you to track the entire structure of a domain, from CSS, HTML, PHP, etc.
For this example, we have used the paid version, although the free one offers us a collection of up to 500 URLs. Now, what interests us with Screaming Frog is to see what our internal links are to, later, visualize them with Gephi.
For this, just put the URL that interests us in the search engine above.
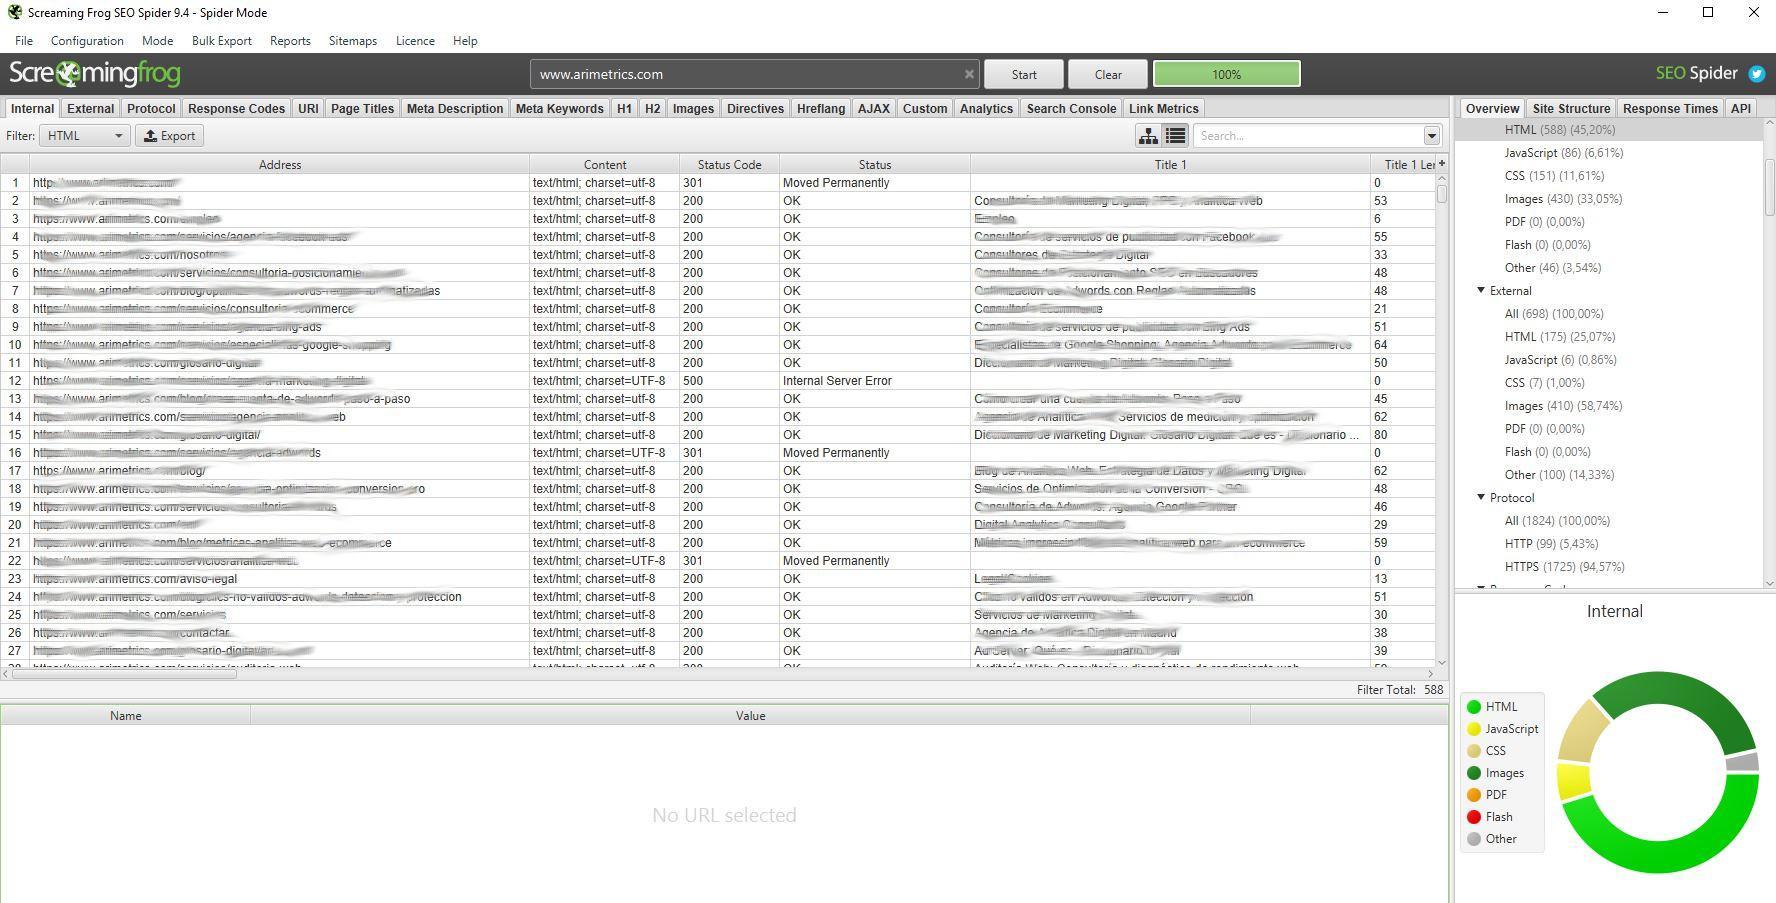
Once, 100% of the data has been loaded (a process that will take several minutes, depending on the size of the website), we look at the ‘Internal’ tab. This is where all our internal linksare. To make the handling of the data easier and the visualization more concrete and detailed, we will filter by HTML (this option is only available in the paid version, but you can also clean the database later, using filters).
When your crawl is finished, we export them as shown in the following image:

Before importing the data into Gephi,clean the spreadsheet:
- Delete the first row containing ‘All Links’.
- Delete the first column, ‘Type’.
- Rename the column ‘Destination’ to ‘Target’
- Delete the rest of the columns. If you prefer, you can leave other columns such as the status code or anchor text. This will depend on the data you prefer to display in the chart. In any case, the fields that interest us now are ‘Source’ and ‘Target’.

As we have mentioned before, in case of using the free version of Screaming Frog, it will also be necessary to do a data cleaning to filter the images, CSS and JavaScript files. In this way, we will leave only HTML.
2. Import internal link data into Gephi
When the database with all the internal links is organized and structured, it will be time to import them into Gephi. To do this, we will follow the following steps:
- We open Gephi and select the ‘new project’ option
- In the ‘file’ tab (top left) click on ‘import spreadsheet’ (important that it is in CSV format)
- We continue with the preset configuration (separated by commas, edge table and UT8)

- In the options of ‘import parameters’, it is not necessary to make too many changes, since in addition, the database with which we are working for this example, is not too extensive. In any case, we have to look at the fact that our text fields contain ‘string’ and the fields with numeric values are marked with the option ‘integer’ or ‘float’.

- Once this, before finishing and if everything is correct we will see an image like this:

3. Calculate the PageRank and modularity of our internal links with Gephi
In case the process of importing our database to Gephi has been correct, we will be presented with this black box on the screen that appears when clicking on the upper left tab ‘overview’.
This visualization that is obviously not useful, will be the one that we will change to be representative.

As we can see, to the right of the panel is the ‘statistics’ part, in which we find several indicators. On this occasion, we will pay attention to ‘PageRank’ and click on ‘run’ with the preset settings. (Important, when we talk about this metric here we are not referring to Google’s Page Rank,but to a ranking that Gephi’s own system elaborates).
We repeat the same process with ‘modularity’. On this occasion, it may have to be executed several times, so that it refines optimally. Unlike PageRank, with modularity we do not leave the configuration established, but we uncheck the box of ‘use weights’.
Modularity groups pages that are more connected to each other into groups or classes. Each represented by a number. For example, in our case, which we are analyzing ‘www.arimetrics.com’, the blog links could be represented as follows:
Group 1: Blog
Group 2: Digital Glossary
Group 3: Services
To check that the process we have followed was correct, just go to the ‘data laboratory’ (upper left corner) and check that two new columns have been generated with ‘PageRank’ and ‘modularity’. In the latter, it is convenient to see that the sections that have been grouped together make sense.
4. We started visualizing internal links with Gephi
Once all the above steps have been done, the time has come to shape our visualization of internal links with Gephi. The first thing you need to do is select a chart model in the ‘distribution’ tab on the left. In this case, we select ‘ForceAtlas 2’.

Now, the parameters of this type of graph go to the taste of the consumer. It is about choosing what we like most visually or what we think will best represent the goal we are looking for. For this example what we have done is to modify the ‘gravity’ section and change it to 0.7 and the ‘scaling’ section up to 1000.
Click on ‘run’ and center the visualization on the screen with the magnifying glass that is in the lower left corner of the drawing. Now we should see something like this. Obviously, the display of internal links will change depending on how our website is structured.

As we have already said, our intention with this example is to represent the modularity and PageRank of our internal links. A useful way to do this is to adjust the size of the nodes based on PageRank and colors in modularity. In this way, the larger the nodes, the better positioning in the ranking and the more grouped the colors are, the better hierarchy of our website.
To do this, we will be placed in the ‘appearance’ window on the left, select nodes, partition and choose modularity. To see the results click on ‘apply’.

Next, we select ‘nodes’, ‘ranking’ and choose Page Rank. You can also change the parameters as appropriate. Click on apply.

4.1. Modifying the display with Gephi
Now, to give greater meaning to the visualization, it is advisable to tag the nodes to know what each page represents, either with the URL, anchor text… whatever we want to visualize. Of course, before it will be necessary to make small modifications in our database. For example, if we want to add a tag with the URL, we have to go to the ‘data lab’ tab. Once here, we will select in the boxes below ‘copy data to another column’, and copy from ‘d’ to ‘label’ or ‘label’. In short, the idea is to put in ‘label’ what we want to be visualized.
Now, we return to the ‘preview’ tab and we can already shape our internal link display. In the drop-down menu on the left, in default settings, the most common is to choose between: ‘by default’ or ‘by default-Curved edges’. To see the changes we are making, click on the refresh button at the bottom left.
In this way, this is how our visualization of internal links with Gephi would look:

In the parameters menu, we can change the display according to our tastes or needs. Change font size, labels, etc. It is enough to refresh and choose, finally, the option that best suits us.
In the visualization of internal links above, the tags of nodes and borders are not activated, so as not to reveal the identity of the same. But what we can interpret with this graph is that there is an optimal hierarchy of internal backlinks,because the pages are grouped by blocks and linked internally. Remember that each color corresponds to a section of the web and the size of the nodes corresponds to the PageRank calculated by Gephi.
In this type of graphics, it would also be interesting to show the anchor text in the labels, to see if they also meet the same hierarchy. That’s why it’s critical to know what you want to visualize before importing your spreadsheet into Gephi.