The bounce rate in Universal Analytics was defined as the percentage of users who arrive at a website and do not make any interaction before leaving. Until now it was one of the most used metrics to assess user interaction. A bounced user has a session duration of 0 seconds, according to the Universal Analytics model.
The bounce rate in GA4 #
The bounce rate already exists in Google Analytics 4 as of July 2022. It corresponds to the inverse of sessions with interaction.
We could say that these metrics are the inverse of the bounce rate. Before we looked at the users who did not interact and now we look at those who do.
How to view bounce rate #
In Google Analytics 4 we can see Bounce Rate it by customizing the default reports, such as through scans.
View bounce in Default Reports #
Bounce rate is a metric that we can add to existing reports.
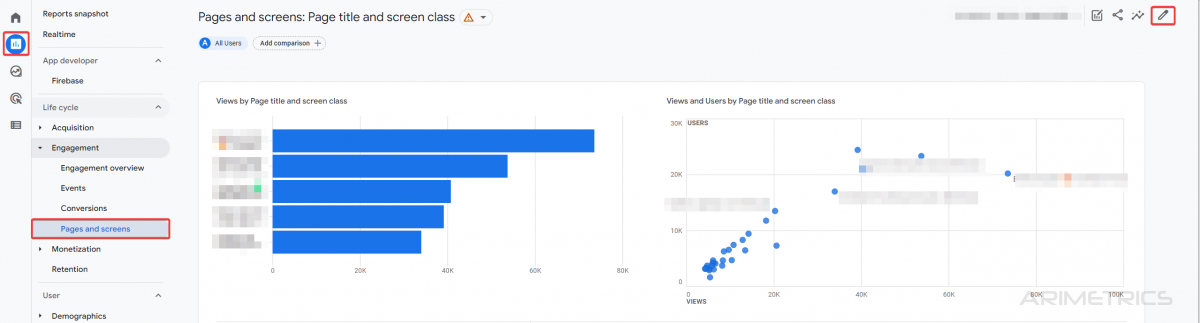
We can see, below, how to add it to the report of pages and screens. We will have to click on the pencil that appears in the upper right
Then, in the right side menu of customize report, we select metrics

We select Add metric in the menu that is displayed
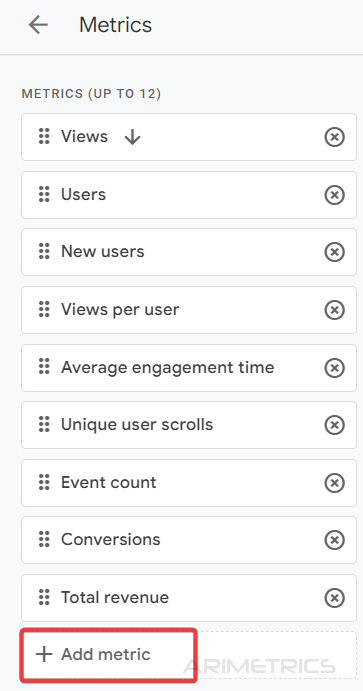
Finally, select the metric “Bounce rate” and press the “Apply” button

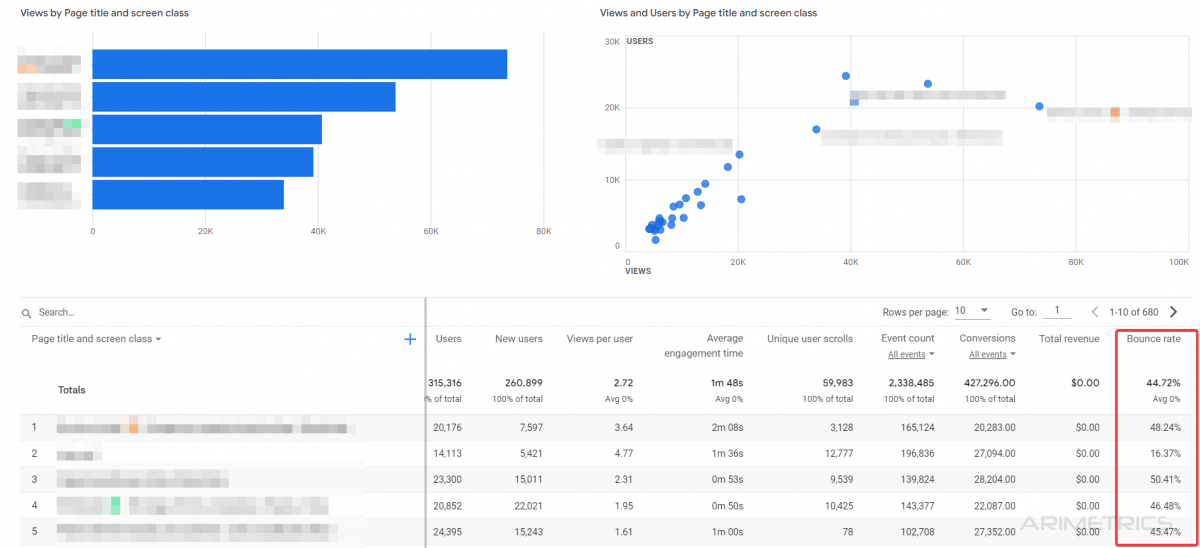
After these steps we will see that the last column of our report already contains the data of “Bounce rate”
View bounce in Exploration Reports #
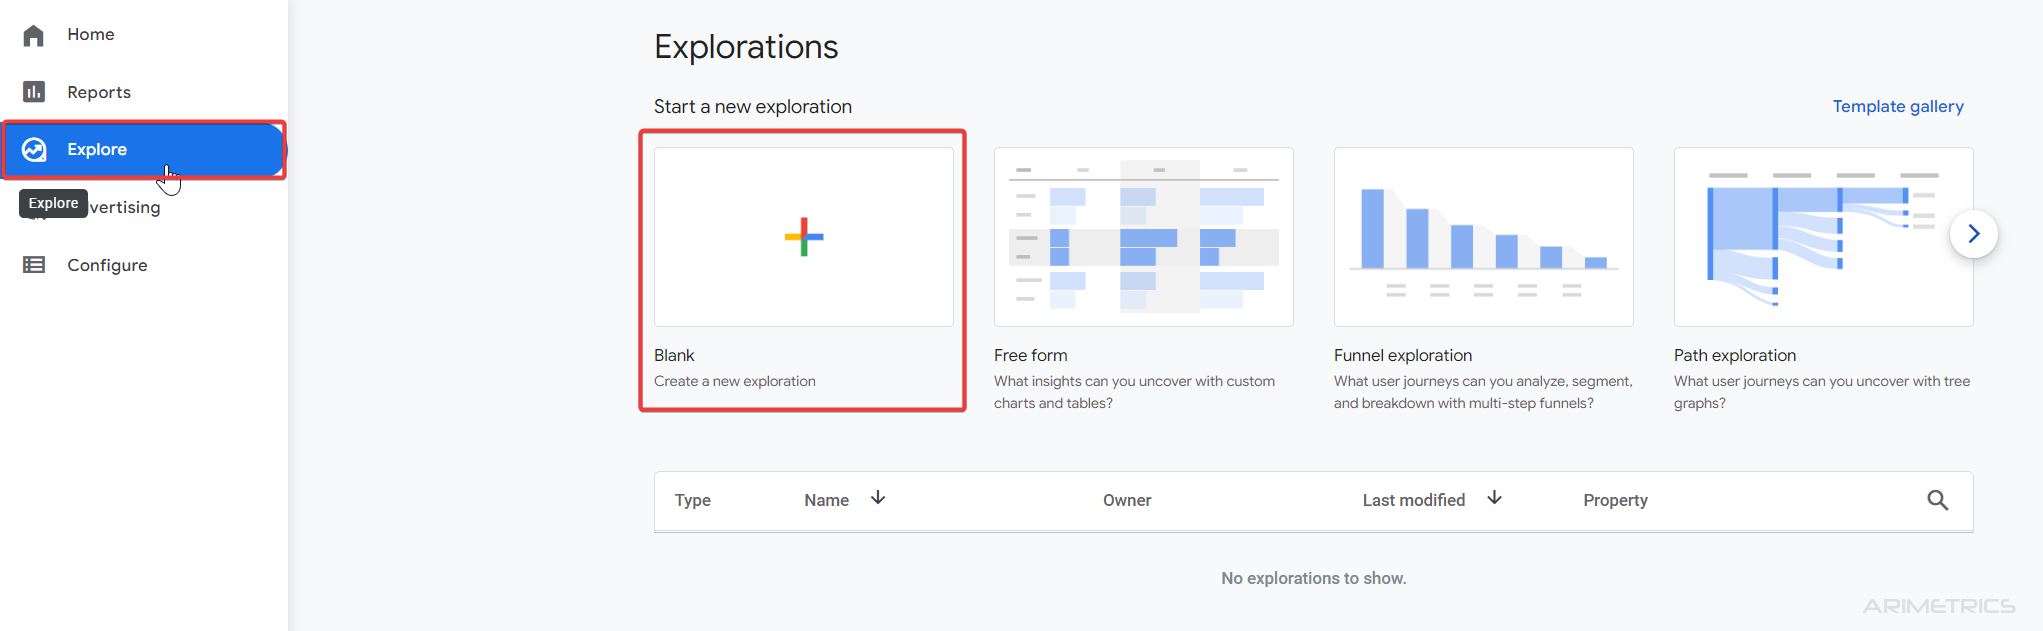
To do this we create a new report (exploration)
- Click Explore
- Blank scan

- Add in the left column (variables) dimension “Page path + query strikc”
- Add Metrics “Sessions”, and “Bounce Rate”
- Add in “Tab Settings”, in Rows “Page Path + query string”
- Add in “Values” “Sesions”, amd “Bounce Rate”
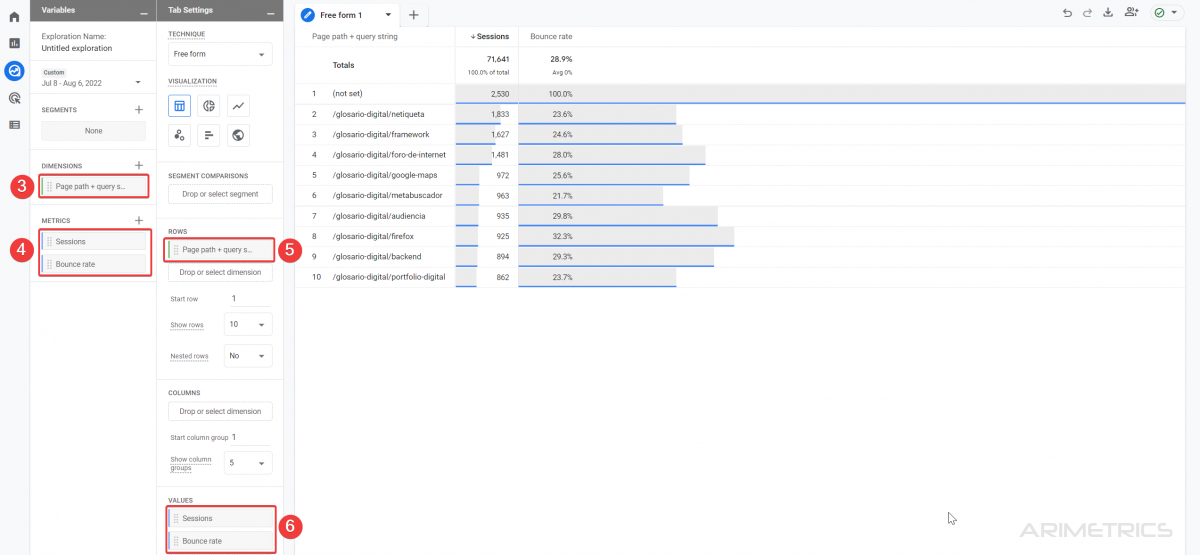
With this we will obtain a report in which we can measure the user bounce rate, that is, the percentage of users who have not interacted with the website.


